
News
Utz Brands to Eliminate FD&C Colors from Product Portfolio by 2027
HANOVER, PA -- (BUSINESS WIRE) – Utz Brands, Inc. (NYSE: UTZ) (“Utz” or the “Company”), a leading U.S. manufacturer of branded salty snacks, issued the following statement regarding the removal of certified Food, Drug and Cosmetic (“FD&C”) colors from its product portfolio: “Since 1921, Utz Brands, Inc. has been committed to making snacks with quality, transparency, and simple, trusted ingredients. As consumer tastes and government regulatory initiatives evolve, we adapt while staying true to the flavors and traditions people love. Today, 80% of our product portfolio does not contain FD&C colors, and several of our brands are completely free of them. We will eliminate all FD&C colors from our entire product portfolio by the end of 2027. Starting this fall, we will be highlighting our real and simple product attributes on select brand packages. For over 100 years, Utz Brands has delivered high-quality products that align with consumer preferences and government standards. We look forward to continuing to produce products that consumers know and love.” Utz Brands snack foods are available in leading retailers across the U.S. or online at Utzsnacks.com. Use @UtzSnacks on Facebook, Instagram, and TikTok to join the conversation. About Utz Brands, Inc. Utz Brands, Inc. (NYSE: UTZ) manufactures a diverse portfolio of savory snacks through popular brands, including Utz®, On The Border® Chips & Dips, Zapp’s® and Boulder Canyon®, among others. After over a century with a strong family heritage, Utz continues to have a passion for exciting and delighting consumers with delicious snack foods made from top-quality ingredients. Utz's products are distributed nationally through grocery, mass merchandisers, club, convenience, drug, and other channels. Based in Hanover, Pennsylvania, Utz has multiple manufacturing facilities located across the U.S. to serve our growing customer base. For more information, please visit the Company’s website or call 1-800-FOR-SNAX. Forward-Looking Statements Certain statements made herein are not historical facts but are "forward-looking statements" within the meaning of the "safe harbor" provisions of the Private Securities Litigation Reform Act of 1995, as amended. The forward-looking statements generally are accompanied by or include, without limitation, statements such as "will," "expect," "intends," “plans,” "goal," or other similar words, phrases, or expressions. These statements are based on the current expectations of the Company's management and are not predictions of actual performance. These statements are subject to a number of risks and uncertainties, and the Company's business and actual results may differ materially. Those factors include, but are not limited to, the risk factors set forth in the Company’s filings with the Securities and Exchange Commission, including the Company’s most recently filed Annual Report on Form 10-K and subsequent reports on Forms 10-Q and 8-K. The Company disclaims and does not undertake any obligation to update, revise, or withdraw any forward-looking statement in this press release, except as required by applicable law or regulation. Investor Relations Media Contact Utz Brands, Inc. Trevor Martin tmartin@utzsnacks.com Utz Brands, Inc. Colleen Farley cfarley@utzsnacks.com
Read moreNews
Utz Brands Announces Investments in Hanover Campus
HANOVER, PA -- (BUSINESS WIRE) – Utz Brands, Inc. (NYSE: UTZ) (“Utz” or the “Company”), a leading U.S. manufacturer of branded salty snacks, is pleased to announce a multi-phase project aimed at upgrading facilities across the Utz Hanover, Pennsylvania campus. The following investments will begin in the coming months: Utz Employee Hub: Construction will begin in 2026 to upgrade Utz’s headquarters at 900 High Street and transform it into a modern Utz Employee Hub. Teams working across the Hanover campus will be moved to the Utz Employee Hub where they will work in a collaborative and integrated workspace, with upgraded technology and modern, flexible offices, workspaces, and meeting rooms. Fitness Center, DSD Warehouse and Employee Health Center: The Fitness Center and DSD warehouse at 350 Kindig Lane will move to the 900 High Street campus as part of this transition. The Employee Health Center will remain at 240 Kindig Lane. Utz Community Center: Utz’s Carlisle Street Plant 1 location will continue to house the Utz Outlet Store, the iconic Utz neon sign and the Utz community pavilion. Utz plans to create a modern Utz Community Center on this site in the future. 1040 High Street and 350 Kindig Lane: Utz will place the buildings at 1040 High Street and 350 Kindig Lane up for sale. “Utz is proud to have called Hanover headquarters for over 100 years, and we’re pleased to share that the work that began with the opening of the Rice Distribution Center last year was only the beginning of our investments here in Hanover,” said Howard Friedman, CEO of Utz Brands, Inc. “This work underscores our commitment to building on our legacy in Hanover while preparing for our future. We are excited to invest in more efficient spaces that will support our associates and the community for many years to come.” Utz Brands snack foods are available in leading retailers across the U.S. or online at Utzsnacks.com. Use @UtzSnacks on Facebook, Instagram, and TikTok to join the conversation. About Utz Brands, Inc. Utz Brands, Inc. (NYSE: UTZ) manufactures a diverse portfolio of savory snacks through popular brands, including Utz®, On The Border® Chips & Dips, Zapp’s® and Boulder Canyon®, among others. After over a century with a strong family heritage, Utz continues to have a passion for exciting and delighting consumers with delicious snack foods made from top-quality ingredients. Utz's products are distributed nationally through grocery, mass merchandisers, club, convenience, drug, and other channels. Based in Hanover, Pennsylvania, Utz has multiple manufacturing facilities located across the U.S. to serve our growing customer base. For more information, please visit the Company’s website or call 1-800-FOR-SNAX. Forward-Looking Statements Certain statements made herein are not historical facts but are "forward-looking statements" within the meaning of the "safe harbor" provisions of the Private Securities Litigation Reform Act of 1995, as amended. The forward-looking statements generally are accompanied by or include, without limitation, statements such as "will," "expect," "intends," "goal," or other similar words, phrases, or expressions. These statements are based on the current expectations of the Company's management and are not predictions of actual performance. These statements are subject to a number of risks and uncertainties, and the Company's business and actual results may differ materially. Investor Relations Media Contact Utz Brands, Inc. Trevor Martin tmartin@utzsnacks.com Utz Brands, Inc. Colleen Farley cfarley@utzsnacks.com
Read more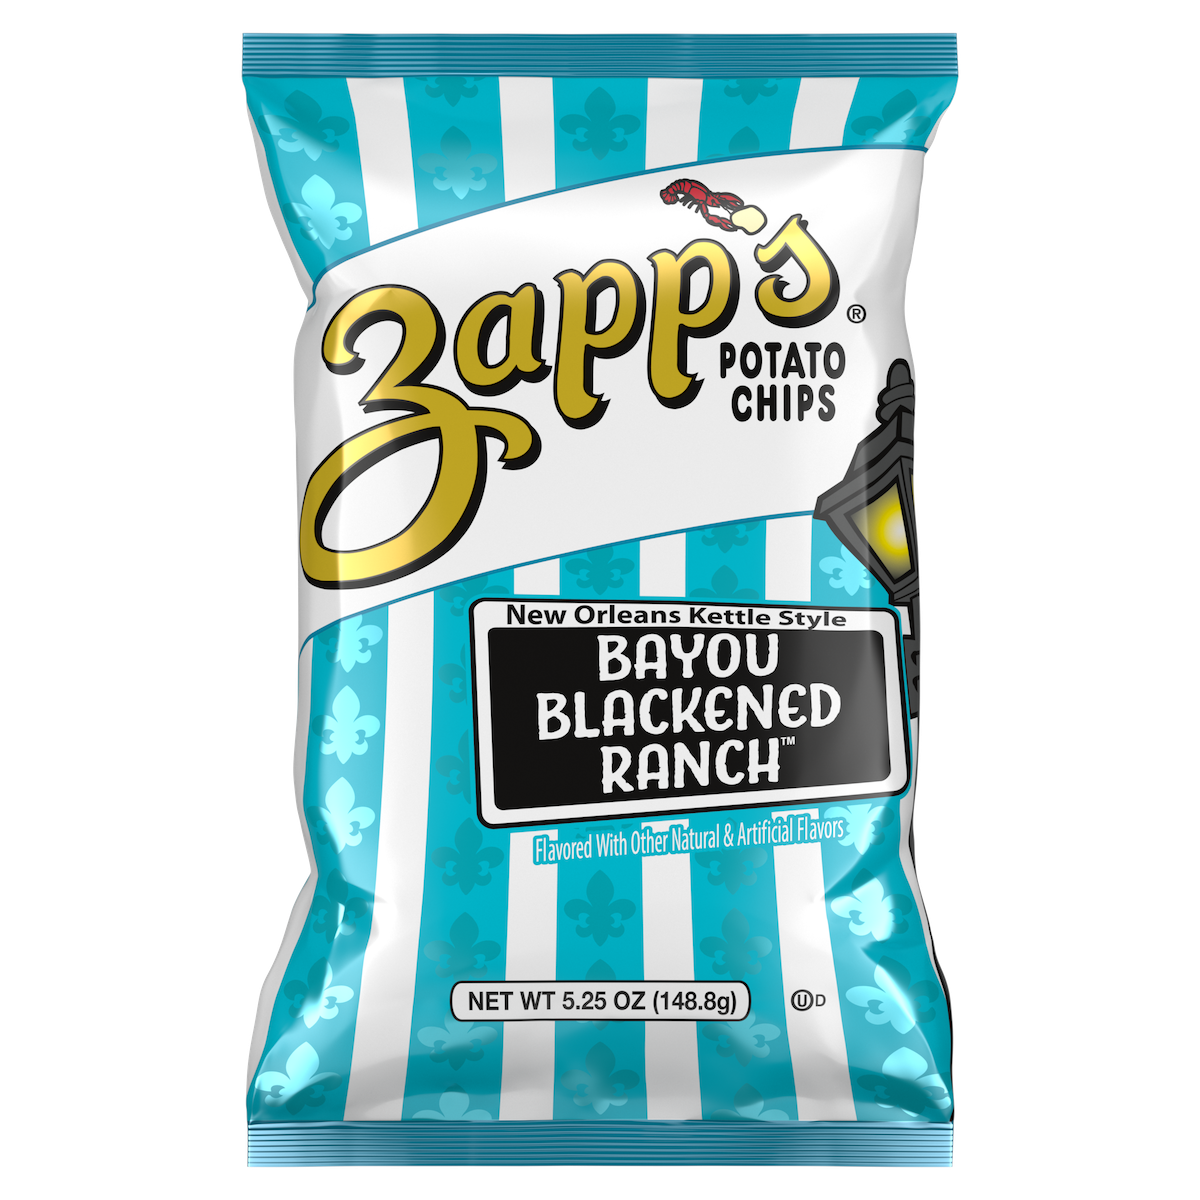
ZAPP’S LAUNCHES NEW BAYOU BLACKENED RANCH KETTLE CHIPS
Bold, New Orleans-inspired flavor combines Cajun-style blackened seasoning with zesty ranch for a taste of Louisiana.
Read more
Utz Brands Reports Second Quarter 2025 Results
Hanover, PA – July 31, 2025 – Utz Brands, Inc. (NYSE: UTZ) (“Utz” or the “Company”), a leading U.S. manufacturer of branded Salty Snacks and a small-cap value Staples equity, today reported financial results for the Company’s second fiscal quarter ended June 29, 2025. 2Q’25 Summary(1) • Net Sales increased 2.9% to $366.7 million • Total Organic Net Sales increased 2.9%; Branded Salty Snacks increased 5.4% • Gross Profit Margin decline of 40bps • Adjusted Gross Profit Margin expansion of 220bps • Net Income decreased 60.2% to $10.1 million • Adjusted Net Income decreased 14.2% to $23.6 million • Adjusted EBITDA decreased 2.0% to $48.7 million • Diluted Earnings Per Share decreased 47.8% to $0.12 • Adjusted Earnings Per Share decreased 10.5% to $0.17 (1) All comparisons for the second quarter of 2025 are to the second quarter of 2024 (ended June 30, 2024). “I am pleased with our strong performance in the second quarter, with Organic Net Sales growth of nearly 3%(1). Our Branded Salty Snacks portfolio is accelerating, with 5.4% growth in the quarter(1). We gained value and volume shares in both our Core and Expansion Geographies(3). Our proactive approach to cost management and operational excellence has enabled us to achieve significant Adjusted Gross Profit Margin expansion,” said Howard Friedman, Chief Executive Officer of Utz. Mr. Friedman continued, “We’re encouraged by our summer sales performance thus far, as we successfully capitalize on seasonal demand and snacking occasions. Our strong performance illustrates our ability to deliver growth independent of the category in a rational competitive environment. Looking ahead to the remainder of 2025, we expect our strong productivity cost savings will continue to provide us with the flexibility to invest in our brands, while expanding profit margins. With geographic expansion driving much of our growth strategy, we remain on track to deliver solid results in 2025 and continue to create long-term shareholder value.” “We are raising our 2025 Organic Net Sales outlook to reflect stronger revenue trends through the first half and our confidence in the growth drivers ahead,” said Bill Kelley, EVP and Chief Financial Officer of Utz. “We now expect Organic Net Sales growth of 2.5% or better, driven by our advantaged portfolio of brands and expansion geographies. We are also tightening our Adjusted EBITDA range to 7% to 10% growth, reflecting our confidence in the significant productivity programs ramping in the second half. We are lowering our Adjusted Earnings Per Share guidance to 7 to 10% growth due to higher interest and depreciation & amortization linked to our accelerated capex investments. We believe these strategic investments in our manufacturing network and automation capabilities will position us for sustained Adjusted EBITDA margin expansion and continued geographic expansion in 2026 and beyond.” Second Quarter 2025 Results Second quarter Net Sales increased 2.9% to $366.7 million compared to $356.2 million in the prior year period. Organic Net Sales also increased 2.9% year-over-year, driven by a favorable volume/mix contribution of 3.9%, or 3.1% excluding a 0.8 percentage point benefit from bonus packs in April. This was partially offset by lower net price realization of (1.0)%, which included a (0.8) percentage point impact from bonus packs and other net price impacts of (0.2) percentage points. The net impact on second quarter sales from bonus packs was neutral. Branded Salty Snacks Organic Net Sales(3) (representing 88% of total Net Sales) increased 5.4% led by our Power Four Brands, offset by an 11.8% decline in Non- Branded & Non-Salty Snacks Organic Net Sales(3), primarily due to Partner Brands and Dips & Salsas. For the 13-week period ended June 29, 2025, the Company’s Branded Salty Snacks Retail Sales increased 3.3% versus the prior year period compared to a 1.5% decline for the Salty Snack category overall(3). The Company’s Retail Volumes increased by 4.3% compared to a 1.5% decline for the Salty Snack category, and the Company drove volume share gains in both its Core and Expansion geographies(2)(3) . The Company’s Power Four Brands of Utz®, On The Border®, Zapp’s® and Boulder Canyon® Retail Sales increased by 5.7%. Gross Profit Margin of 34.6% declined 40bps compared to 35.0% in the prior year period. Adjusted Gross Profit Margin of 39.8% expanded 220bps compared to 37.6% in the prior year period. The increase was driven by productivity savings, which more than offset increased investments to support capacity expansion and growth. Selling, Distribution, and Administrative Expenses (“SD&A Expenses”) were $119.5 million, or 32.6% of Net Sales, compared to $104.6 million, or 29.4% of Net Sales, in the prior year period. Adjusted SD&A Expenses were $97.3 million, or 26.5% of Net Sales, compared to $84.5 million, or 23.7% of Net Sales, in the prior year period. The increase as a percentage of Net Sales was primarily due to adding capabilities, selling, and delivery costs to support the Company’s geographic expansion and growth initiatives. The Company reported Net Income of $10.1 million compared to Net Income of $25.4 million in the prior year period. Adjusted Net Income in the quarter decreased 14.2% to $23.6 million compared to $27.5 million in the prior year period. Adjusted Earnings Per Share decreased 10.5% to $0.17 compared to $0.19 in the prior year period. The Adjusted Earnings Per Share decline in the second quarter was the result of higher SD&A expenses, higher depreciation and amortization, and higher interest expense. Adjusted EBITDA decreased 2.0% to $48.7 million, or 13.3% as a percentage of Net Sales, compared to $49.7 million, or 14.0% as a percentage of Net Sales, in the prior year period. The decline in Adjusted EBITDA was driven by increased SD&A expenses, which more than offset the positive impact of Adjusted Gross Profit Margin expansion. (1) Versus prior year period. (2) As measured by Circana MULO+ w/convenience. (3) See “Other Defined Terms” for definitions. Balance Sheet and Cash Flow Highlights • As of June 29, 2025 ◦ Total liquidity of $170.9 million, consisting of cash on hand of $54.6 million and $116.3 million available under the Company’s revolving credit facility. ◦ Net debt of $826.3 million resulting in a Net Leverage Ratio of 4.1x based on trailing twelve months Normalized Adjusted EBITDA of $200.9 million. • For the twenty-six weeks ended June 29, 2025 ◦ Cash flow used in operations was $3.9 million, which reflects the seasonal use of working capital. ◦ Capital expenditures were $65.7 million, and dividends and distributions paid were $20.1 million. Supply Chain Transformation Plan Update As part of Utz's ongoing supply chain transformation, the Company is announcing the strategic decision to consolidate its manufacturing footprint from eight primary(1) plants to seven, with the closure of its Grand Rapids, Michigan manufacturing facility. This decision is a key component of the Company’s long-term strategic roadmap, and is expected to generate cost savings during the second half of 2025. These savings are part of Utz’s previously communicated target of approximately 6% productivity savings as a percentage of Adjusted COGS in fiscal year 2025. This transition is planned to begin in August and be completed by early 2026. The consolidation should enable the Company to allocate more volume to its larger, more efficient facilities, while driving fixed cost leverage and enhanced automation capabilities across its remaining network. In addition to the expected cost savings, the Company expects the optimized footprint to support its ongoing geographic expansion. “The decision is a reflection of our commitment to operational excellence and ongoing transformation,” said Friedman. “While these types of decisions are never easy, they are necessary steps to streamline our operations and strengthen our supply chain for the long-term. We are deeply grateful for the contributions of our Grand Rapids team and are committed to supporting them through this transition.” All impacted associates will be encouraged to apply for opportunities at other Utz facilities, and provided transition assistance including on-site job fairs and severance pay if they cannot relocate. (1) Excludes Plant 1 in Hanover given limited production. Fiscal Year 2025 Outlook The Company is updating its 2025 fiscal year outlook to reflect stronger top-line trends and higher Adjusted EBITDA. The company is lowering expected Adjusted EPS growth due to higher capital expenditures, depreciation and amortization, and interest expense. The Company now expects: • Organic Net Sales growth of 2.5% or better, compared to the prior expectation of low-single digits. We expect Organic Net Sales growth will be led by Branded Salty Snacks growth, particularly the Power Four Brands, and less decline in Non-Branded & Non-Salty Snacks; • Adjusted EBITDA growth of 7% to 10%, compared to the prior expectation of 6% to 10%. The Company expects Adjusted EBITDA Margin expansion of approximately 100bps, which is consistent with the Company’s previously provided guidance. We expect Adjusted EBITDA Margin expansion will be led by Adjusted Gross Profit Margin expansion fueled by strong productivity cost savings and improved product mix; and • Adjusted Earnings Per Share growth of 7% to 10%, compared to the prior expectation of 10% to 15%, due to higher interest expense and depreciation and amortization linked to accelerated capital expenditures related to the Company’s network optimization and facility consolidation efforts. Key assumptions for the Company’s fiscal 2025 outlook include: • An effective tax rate (normalized GAAP basis tax expense, which excludes one-time items) in the range of 17% to 19%, consistent with the Company’s previously provided expectation; • Interest Expense of approximately $46 million, compared to the prior expectation of $43 million; • Capital Expenditures are now expected to be approximately $100 million, the high end of the previously provided range of $90 to $100 million, with the majority focused on building increased supply chain network capabilities and delivering accelerated productivity savings; and • Net Leverage Ratio approaching 3x at year-end fiscal 2025. Quantitative reconciliations are not available for the forward-looking non-GAAP financial measures used herein without unreasonable efforts due to the high variability, complexity, and low visibility with respect to certain items which are excluded from Organic Net Sales, Adjusted EBITDA, Net Leverage Ratio, normalized GAAP basis tax expense, excluding one-time items, and Adjusted Earnings Per Share, respectively. We expect the variability of these items to have a potentially unpredictable, and potentially significant, impact on our future financial results. Conference Call and Webcast Presentation The Company has also posted a pre-recorded management discussion of its second quarter results to its website at https://investors.utzsnacks.com. In addition, the Company will host a live question and answer session with analysts at 9:30 a.m. Eastern Time today. Please visit the “Events & Presentations” section of Utz’s Investor Relations website at https://investors.utzsnacks.com to access the live listen-only webcast. Participants can also dial in over the phone by calling 1-888-596-4144. The Event Plus passcode is 3860587. The Company has also posted presentation slides and additional supplemental financial information, which are available now on Utz’s Investor Relations website. About Utz Brands, Inc. Utz Brands, Inc. (NYSE: UTZ) manufactures a diverse portfolio of savory snacks through popular brands, including Utz®, On The Border® Chips & Dips, Zapp’s®, and Boulder Canyon®, among others.After over a century with a strong family heritage, Utz continues to have a passion for exciting and delighting consumers with delicious snack foods made from top-quality ingredients. Utz's products are distributed nationally through grocery, mass merchandisers, club, convenience, drug, and other channels. Based in Hanover, Pennsylvania, Utz has multiple manufacturing facilities located across the U.S. to serve our growing customer base. For more information, please visit the Company’s website or call 1-800-FOR-SNAX.Investors and others should note that Utz announces material financial information to its investors using its Investor Relations website, U.S. Securities and Exchange Commission (the “Commission”) filings, press releases, public conference calls, and webcasts. Utz uses these channels, as well as social media, to communicate with our stockholders and the public about the Company, the Company’s products, and other Company information. It is possible that the information that Utz posts on social media could be deemed to be material information. Therefore, Utz encourages investors, the media, and others interested in the Company to review the information posted on the social media channels listed on Utz’s Investor Relations website. Forward-Looking Statements This press release includes certain statements made herein that are not historical facts but are “forward-looking statements” within the meaning of the “safe harbor” provisions of the Private Securities Litigation Reform Act of 1995, as amended. The forward-looking statements generally are accompanied by or include, without limitation, statements such as “may,” “can,” “should,” “will,” “estimate,” “plan,” “project,” "forecast,” "intend,” "expect,” “anticipate,” “believe,” “seek,” “target” “goal”, “on track””. These forward-looking statements include future plans for the Company, including outlook for fiscal 2025, plans related to the transformation of the Company’s supply chain, the Company’s product mix, the Company’s expectations regarding its level of indebtedness and associated interest expense impacts; the estimated or anticipated future results and benefits of the Company’s future plans and operations; the Company’s cost savings plans and the Company’s logistics optimization efforts; the estimated or anticipated future results and benefits of the Company’s plans and operations; the effects of tariffs, inflation or supply chain disruptions on the Company or its business; the benefits of the Company’s productivity initiatives; the effects of the Company’s marketing and innovation initiatives; the Company’s future capital structure; future opportunities for the Company’s growth; statements regarding the Company’s projected balance sheet and liabilities, including net leverage; and other statements that are not historical facts. These statements are based on the current expectations of the Company’s management and are not predictions of actual performance. These statements are subject to a number of risks and uncertainties and the Company’s business and actual results may differ materially. Some factors that could cause actual results to differ include, without limitation: our operation in an industry with high levels of competition and consolidation; our reliance on key customers and ability to obtain favorable contractual terms and protections with customers; changes in demand for our products driven by changes in consumer preferences and tastes or our ability to innovate or market our products effectively; changes in consumers’ loyalty to our brands due to factors beyond our control; impacts on our reputation caused by concerns relating to the quality and safety of our products, ingredients, packaging, or processing techniques; the potential that our products might need to be recalled if they become adulterated or are mislabeled; the loss of retail shelf space and disruption to sales of food products due to changes in retail distribution arrangements; our reliance on third parties to effectively operate both our direct-to-warehouse delivery system and our direct-store-delivery network system; the evolution of e-commerce retailers and sales channels; disruption to our manufacturing operations, supply chain, or distribution channels; the effects of inflation, including rising labor costs; shortages of raw materials, energy, water, and other supplies; changes in the legal and regulatory environments in which we operate, including with respect to tax legislation such as the One Big Beautiful Bill Act; potential liabilities and costs from litigation, claims, legal or regulatory proceedings, inquiries, or investigations into our business; potential adverse effects or unintended consequences related to the implementation of our growth strategy; our ability to successfully identify and execute acquisitions or dispositions and to manage integration or carve out issues following such transactions; the geographic concentration of our markets; our ability to attract and retain highly skilled personnel (including risks associated with our recently announced executive leadership transition); impairment in the carrying value of goodwill or other intangible assets; our ability to protect our intellectual property rights; disruptions, failures, or security breaches of our information technology infrastructure; climate change or legal, regulatory or market measures to address climate change; our exposure to liabilities, claims or new laws or regulations with respect to environmental matters; the increasing focus and opposing views, legislation and expectations with respect to ESG initiatives; restrictions on our operations imposed by covenants in our debt instruments; our exposure to changes in interest rates; adverse impacts from disruptions in the worldwide financial markets, including on our ability to obtain new credit; our exposure to any new or increased income or product taxes; pandemics, epidemics or other disease outbreaks; our exposure to changes to trade policies and tariff and import/export regulations by the United States and other jurisdictions; potential volatility in our Class A Common Stock caused by resales thereof; our dependence on distributions made by our subsidiaries; our payment obligations pursuant to a tax receivable agreement, which in certain cases may exceed the tax benefits we realize or be accelerated; provisions of Delaware law and our governing documents and other agreements that could limit the ability of stockholders to take certain actions or delay or discourage takeover attempts that stockholders may consider favorable; our exclusive forum provisions in our governing documents; the influence of certain significant stockholders and members of Utz Brands Holdings, LLC, whose interests may differ from those of our other stockholders; and the effects of our private placement warrants on the market price of our Class A Common Stock and our net income; and other risks and uncertainties set forth in Part I, Item 1A “Risk Factors” in our Annual Report on Form 10-K filed with the Commission for the fiscal year ended December 29, 2024 and in other reports we file with the U.S. Securities and Exchange Commission from time to time. Forward-looking statements provide the Company’s expectations, plans or forecasts of future events and views as of the date of this communication. These forward-looking statements should not be relied upon as representing the Company’s assessments as of any date subsequent to the date of this communication. The Company cautions investors not to place undue reliance upon any forward-looking statements, which speak only as of the date made. The Company does not undertake or accept any obligation or undertaking to release publicly any updates or revisions to any forward-looking statements to reflect any change in its expectations or any change in events, conditions, or circumstances on which any such statement is based, except as otherwise required by law. Non-GAAP Financial Measures: Utz uses non-GAAP financial information and believes it is useful to investors as it provides additional information to facilitate comparisons of historical operating results and identify trends in our underlying operating results, and it provides additional insight and transparency on how we evaluate the business. We use non-GAAP financial measures to budget, make operating and strategic decisions, and evaluate our performance. These non-GAAP financial measures do not represent financial performance in accordance with generally accepted accounted principles in the United States (“GAAP”) and may exclude items that are significant to understanding and assessing financial results. Therefore, these measures should not be considered in isolation or as an alternative to net income, cash flows from operations, earnings per share or other measures of profitability, liquidity, or performance under GAAP. You should be aware that the presentation of these measures may not be comparable to similarly titled measures used by other companies. Management believes that non-GAAP financial measures should be considered as supplements to the GAAP measures reported, should not be considered replacements for, or superior to, the GAAP measures, and may not be comparable to similarly named measures used by other companies. The Company’s calculation of the non-GAAP financial measures may differ from methods used by other companies. We believe that these non-GAAP financial measures provide useful information to investors regarding certain financial and business trends relating to the financial condition and results of operations of the Company to date when considered with both the GAAP results and the reconciliations to the most comparable GAAP measures, and that the presentation of non-GAAP financial measures is useful to investors in the evaluation of our operating performance compared to other companies in the Salty Snack industry, as similar measures are commonly used by the companies in this industry. These non-GAAP financial measures are subject to inherent limitations as they reflect the exercise of management judgment about which items of expense and income are excluded or included in determining these non-GAAP financial measures. The non-GAAP financial measures are not recognized in accordance with GAAP and should not be viewed as an alternative to GAAP measures. As new events or circumstances arise, these definitions could change. When the definitions change, we will provide the updated definitions and present the related non-GAAP historical results on a comparable basis. Utz uses the following non-GAAP financial measures in its financial communications, and in the future could use others: • Organic Net Sales • Adjusted Gross Profit • Adjusted Gross Profit as % of Net Sales (Adjusted Gross Profit Margin) • Adjusted Selling, Distribution, and Administrative Expense • Adjusted Selling, Distribution, and Administrative Expense as % of Net Sales (Adjusted Selling, Distribution, and Administrative Expense Margin) • Adjusted Net Income • Adjusted Earnings Per Share • Adjusted Earnings Before Taxes • EBITDA • Adjusted EBITDA • Adjusted EBITDA as % of Net Sales (Adjusted EBITDA Margin) • Normalized Adjusted EBITDA • Effective Normalized Tax Rate • Net Leverage Ratio • Adjusted COGS Organic Net Sales is defined as Net Sales excluding the impacts of acquisitions, divestitures and independent operator (“IO”) route conversions that took place after 1Q’2024. Adjusted Gross Profit represents Gross Profit excluding Depreciation and Amortization expense, a non-cash item. In addition, Adjusted Gross Profit excludes the impact of costs that fall within the categories of non-cash adjustments and/or other cash adjustment items such as those related to stock-based compensation, hedging and purchase commitments adjustments, asset impairments, acquisition and integration costs, business transformation initiatives, and financing-related costs. Adjusted Gross Profit is one of the key performance indicators that our management uses to evaluate operating performance. We also report Adjusted Gross Profit as a percentage of Net Sales as an additional measure for investors to evaluate our Adjusted Gross Profit Margin. Adjusted Selling, Distribution, and Administrative Expense is defined as all Selling, Distribution, and Administrative expense excluding Depreciation and Amortization expense, a non-cash item. In addition, Adjusted Selling, Distribution, and Administrative Expense excludes the impact of costs that fall within the categories of non-cash adjustments and/or other cash adjustment items such as those related to stock-based compensation, hedging and purchase commitments adjustments, asset impairments, acquisition and integration costs, business transformation initiatives, and financing- related costs. We also report Adjusted Selling, Distribution, and Administrative Expense as a percentage of Net Sales as an additional measure for investors to evaluate our Adjusted Selling, Distribution, and Administrative Margin. Adjusted Net Income is defined as Net Income excluding Depreciation and Amortization expense, a non-cash item, related to fair value adjustments on property, plant, and equipment, and definite-lived intangibles relating to business combinations recorded in prior periods. In addition, Adjusted Net Income excludes deferred financing fees, interest income, and expense relating to IO loans and certain non-cash adjustments and/or other cash adjustment items such as those related to stock-based compensation, hedging, and purchase commitments adjustments, asset impairments, acquisition and integration costs, business transformation initiatives, remeasurement of warrant liabilities and financing- related costs. Lastly, Adjusted Net Income normalizes the income tax provision to account for the above-mentioned adjustments. Adjusted Earnings Before Taxes is defined as Adjusted Net Income before normalized GAAP basis tax expense. Adjusted Earnings Per Share is defined as Adjusted Net Income divided by the weighted average shares outstanding for each period on a fully diluted basis, assuming the private placement warrants are net settled and the shares of Class V Common Stock of the Company are converted to Class A Common Stock. EBITDA is defined as Net Income Before Interest, Income Taxes, and Depreciation and Amortization. Adjusted EBITDA is defined as EBITDA further adjusted to exclude certain non-cash adjustments and/or other cash adjustment items, such as stock-based compensation, hedging and purchase commitments adjustments, asset impairments, acquisition and integration costs, business transformation initiatives, and financing-related costs. Adjusted EBITDA is one of the key performance indicators we use in evaluating our operating performance and in making financial, operating, and planning decisions. We believe Adjusted EBITDA is useful to the users of this release because the financial information contained in the release can be used in the evaluation of Utz’s operating performance compared to other companies in the Salty Snack industry, as similar measures are commonly used by companies in this industry. In this release, we also provide Adjusted EBITDA as a percentage of Net Sales as an additional measure for readers to evaluate our Adjusted EBITDA Margin. Normalized Adjusted EBITDA is defined as Adjusted EBITDA after giving effect to pre-acquisition Adjusted EBITDA for certain acquisitions and dispositions from time to time. Effective Normalized Tax Rate is defined as normalized GAAP basis tax expense, which excludes one-time items, divided by Adjusted Earnings before Taxes. Net Leverage Ratio is defined as trailing twelve month Normalized Adjusted EBITDA divided by Net Debt. Net Debt is defined as Gross Debt less Cash and Cash Equivalents. Other Defined Terms: Branded Salty Snacks is defined as Power Four Brands and Other Brands. Power Four Brands consist of the Utz® brand, On The Border®, Zapp’s®, and Boulder Canyon®. Other Brands include Golden Flake®, TORTIYAHS!®, Hawaiian®, Bachman®, Tim’s Cascade®, Dirty Potato Chips®, TGI Fridays® and Vitner's®. Non-Branded & Non-Salty Snacks is defined as partner brands, private label, co-manufacturing for which we are the manufacturer, Utz branded non-salty snacks such as On The Border® Dips and Salsa, and sales not attributable to specific brands.
Read more
Utz Brands Appoints Trevor Martin as Senior Vice President, Investor Relations
HANOVER, Pa. – July 14, 2025 (Business Wire) Utz Brands, Inc. (NYSE: UTZ) (“Utz” or the “Company”), a leading U.S. manufacturer of branded salty snacks, and a small-cap value Staples equity, today announced that Trevor Martin has been appointed Senior Vice President, Investor Relations, effective July 14, 2025. Mr. Martin joins Utz with nearly 20 years of investment management and consumer research experience and will report to William J. Kelley, Executive Vice President & Chief Financial Officer. “Trevor’s background in consumer-focused investment management and research makes him a great fit to lead our investor relations efforts,” said Mr. Kelley. “We are pleased to welcome him to the team and are confident in his ability to continue building on our strong relationships with the investment community.” Mr. Martin joins Utz from Victory Capital/RS Investment Management, a diversified global asset management firm, where he held various positions including Co-Portfolio Manager, RS Growth. He previously served as a research analyst at RBI Capital Management and began his career as an operations associate at Standard Pacific Capital. Mr. Martin holds an MBA from the Haas School of Business at University of California, Berkeley and a BA from George Washington University. Source: Utz Brands, Inc. About Utz Brands, Inc. Utz Brands, Inc. (NYSE: UTZ) manufactures a diverse portfolio of savory snacks through popular brands, including Utz®, On The Border® Chips & Dips, Zapp’s®, and Boulder Canyon®, among others. After over a century with a strong family heritage, Utz continues to have a passion for exciting and delighting consumers with delicious snack foods made from top-quality ingredients. Utz's products are distributed nationally through grocery, mass merchandisers, club, convenience, drug, and other channels. Based in Hanover, Pennsylvania, Utz has multiple manufacturing facilities located across the U.S. to serve our growing customer base. For more information, please visit www.utzsnacks.com or call 1‐800‐FOR‐SNAX. Investor Contact Trevor Martin tmartin@utzsnacks.com Noemie Renaerts nrenaerts@utzsnacks.com Media Contact Kevin Brick kbrick@utzsnacks.com
Read more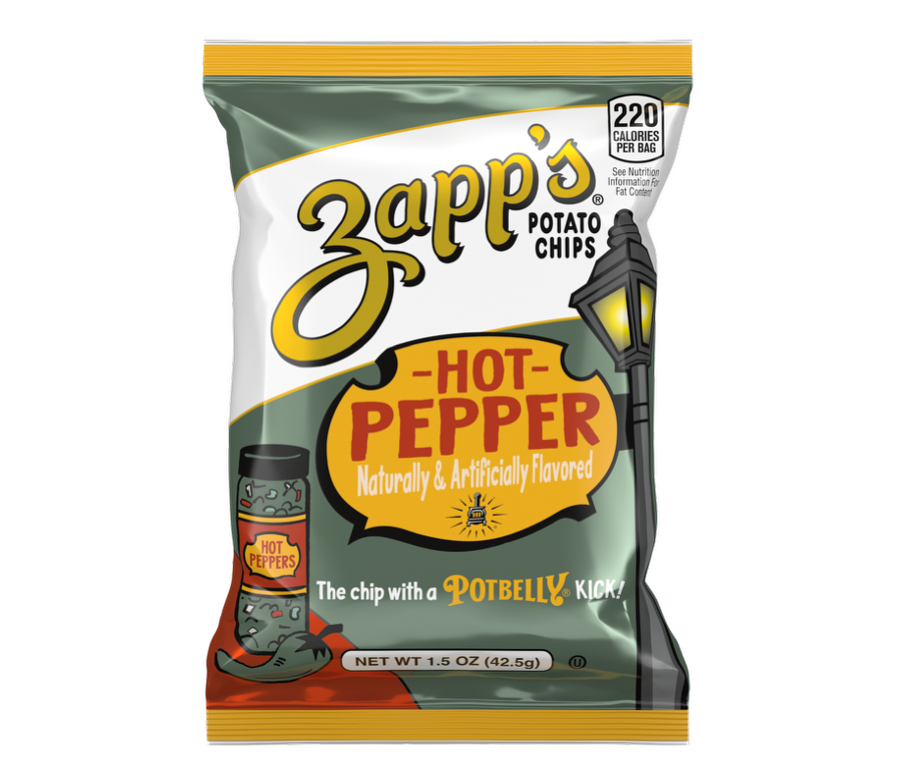
Potbelly and Zapp’s Launch Hot Pepper Chips
CHICAGO, IL -- (BUSINESS WIRE) Potbelly Sandwich Works (NASDAQ: PBPB), the iconic neighborhood sandwich shop, is heating up taste buds this summer with its new signature Hot Pepper Flavored Potato Chips in partnership with Zapp’s® (NYSE: UTZ), the daringly different brand of chips and pretzels with bold flavors rooted in the sights and sounds of The Big Easy. The new chips bring the flavor of Potbelly’s craveable signature Hot Peppers in a spicy, snackable, portable form, now available exclusively at Potbelly shops nationwide. Known for their kettle-style process, fried one batch at a time, Zapp’s Kettle Potato Chips have been the perfect pairing to Potbelly’s oven-toasted sandwiches for more than 15 years. The two brands teamed up for the Hot Pepper Flavored Chips, marrying the taste of a Potbelly fan-favorite with Zapp’s distinctive, crunchy, and bold flavors to offer fans a spicy twist on a classic chip experience. The Hot Pepper Chips join a lineup of longtime Zapp’s favorites, including Voodoo®, Spicy Cajun Crawtators®, Evil Eye®, Salt & Vinegar, and other unique flavors. “Our Hot Peppers have a cult following, with fans adding them to their entrees and sides, enjoying the heat in our signature sauces and hummus, or buying them by the jar to enjoy and share,” said Potbelly Director of Consumer Insights and Menu Innovation Eric Chenel. “Now, we’re thrilled to deliver that bold flavor in a whole new format. These chips are spicy, flavorful, and unmistakably Potbelly. Whether paired with a toasty sandwich or enjoyed on their own, they bring the perfect Potbelly kick that fans have come to expect from our Hot Peppers.” For information on exclusive offers and rewards, Potbelly encourages fans to join the Potbelly Perks program, where they can unlock special offers on the entire menu. To sign up for the Potbelly Perks reward program, visit www.potbelly.com/perks, and for more information on Potbelly, visit www.potbelly.com. To learn more about Zapp’s, visit Zapp’s website or connect with Zapp’s on Facebook, Instagram and TikTok. And, as always, “Laissez les bons temps rouler!” #ZAPPS #ZAPPSHOTPEPPER #ZAPPSPOTBELLY # # # About Potbelly Potbelly Sandwich Works is a neighborhood sandwich concept that has been feeding customers' smiles with warm, toasty sandwiches, signature salads, hand-dipped shakes and other fresh menu items, customized just the way customers want them for more than 40 years. Potbelly promises Fresh, Fast & Friendly service in an environment that reflects the local neighborhood. Since opening its first shop in Chicago in 1977, Potbelly has expanded to neighborhoods across the country – with more than 425 shops in the United States including more than 80 franchised shops in the United States. For more information, please visit www.potbelly.com. About Utz Brands, Inc. Utz Brands, Inc. (NYSE: UTZ) manufactures a diverse portfolio of savory snacks through popular brands, including Utz®, On The Border® Chips & Dips, Zapp’s®, and Boulder Canyon®, among others. After a century with a strong family heritage, Utz continues to have a passion for exciting and delighting consumers with delicious snack foods made from top-quality ingredients. Utz’s products are distributed nationally through grocery, mass merchandisers, club, convenience, drug, and other channels. Based in Hanover, Pennsylvania, Utz has multiple manufacturing facilities across the U.S. to serve its growing customer base. For more information, please visit www.utzsnacks.com or call 1‐800‐FOR‐SNAX. All Points Public Relations (Potbelly) Donna Kang dkang@allpointspr.com (847) 946-7257 SPM Communications (Utz/Zapp’s) Agency Media Contact Kayla Torres kayla@spmcommunications.com Utz Brands, Inc. Media Kevin Brick kbrick@utzsnacks.com
Read more
UTZ BRANDS SHOWCASE SEASONAL SNACK COLLECTIONS, INNOVATIONS AT 2025 SWEETS & SNACKS EXPO
Utz, Zapp’s, Boulder Canyon and On The Border present bold new flavors and beloved brand classics at premier industry event HANOVER, Pa. (BUSINESS WIRE) — Utz Brands, Inc.®, a leading U.S. manufacturer of branded salty snacks for more than 100 years, will showcase its Utz®, Zapp’s®, Boulder Canyon® and On The Border® Chips & Dips fan-favorite products and new flavor innovations in booth #2714 at the 2025 Sweets & Snacks Expo, held May 13-15 in Indianapolis. This year at the Sweets & Snacks Expo, Utz Brands will showcase its extensive year-round seasonal collections, featuring specially crafted snacks for Valentine’s Day, Easter, sports seasons, Halloween and winter holidays. “Our expanded portfolio, from bold flavor collaborations to seasonal offerings, represents our commitment to providing the right snack for every occasion, all year round,” said Stacey Schultz, senior vice president of marketing at Utz Quality Foods, LLC, a subsidiary of Utz Brands, Inc. “We’re meeting consumers at the intersection of tradition and innovation, while maintaining the quality our customers know and love.” Available for a limited time only this summer, Utz’s summer seasonal potato chip is a lemonade-flavored potato chip created as a collaboration between Utz and Alex’s Lemonade Stand Foundation, the largest independent childhood cancer charity in the U.S. The unique new Utz Lemonade Potato Chips combine the tangy sweetness of lemonade with the classic salty crunch of Utz potato chips, delivering a bold, unique flavor experience. Utz will donate a portion of the sales of the chips, up to $25,000, to Alex’s Lemonade Stand Foundation, funding critical research and support for children battling cancer. As spicy snacks continue to drive category growth, Utz Brands has once again partnered with Mike’s Hot Honey®, a leading brand of hot honey that originated in a Brooklyn pizza parlor, on two exciting limited-time offerings: • Utz Cheese Pizza Mike’s Hot Honey flavored Cheese Balls® that combine the taste of pizza with a sweet-and-spicy kick in America’s #1 cheese ball. o Available through October 2025, while supplies last. • Boulder Canyon, the No. 1 potato chip brand in the natural channel and experiencing rapid growth across other retail channels, introduces Mike’s Hot Honey ® flavored kettle-cooked chips made with avocado oil.o Available through March 2026. The Utz Brands portfolio will also highlight additional innovative products in the trending flavored pretzel category, including:• New Utz Sour Cream & Onion Mixed Minis Pretzels, inspired by the brand’s top-selling potato chip flavor.o The new flavor joins Garlic Butter and Mike’s Hot Honey® flavors in the Utz Mixed Minis Pretzel line, first launched in February 2024 in three bite-sized shapes: Twists, Rings and Waffles. • Zapp’s Big Cheezy Sinfully Seasoned® Pretzel Stix, a blend of cheddar cheese flavor and Cajun seasoning for a flavorful, crunchy pretzel. • Big Cheezy joins Zapp’s existing Sinfully Seasoned Pretzel Stix lineup alongside Voodoo®, Jazzy Honey Mustard, Sweet Cinnamon & Sugar and Spicy Cajun. Other new Utz Brands products being sampled at the Sweets & Snacks Expo include:• Boulder Canyon’s new wavy varieties — Wavy Sea Salt and Wavy Cheddar Sour Cream — both cooked in avocado oil, offer a perfectly ridged texture that delivers maximum crunch and flavor in every bite. Boulder Canyon now delivers avocado oil in all segments of the potato chip category. • On The Border, the No. 2 unflavored tortilla chip brand known for its full lineup of restaurant-inspired chips, salsas, and quesos, expands its best-selling Café Style line with two new flavored varieties, Lime & Sea Salt and Garlic & Mexican Herb, lightly seasoned to be the perfect complement for dips. All Utz Brands products are available for purchase online at UtzSnacks.com and leading retailers nationwide. For more information, follow Utz on Facebook, Instagram and TikTok, Zapp’s on Facebook, Instagram and TikTok, Boulder Canyon on Facebook, Instagram and TikTok, and On The Border on Facebook, Instagram and TikTok. About Utz Brands, Inc. Utz Brands, Inc. (NYSE: UTZ) manufactures a diverse portfolio of savory snacks through popular brands including Utz®, On The Border® Chips & Dips, Zapp’s®, and Boulder Canyon®, among others. After a century with a strong family heritage, Utz continues to have a passion for exciting and delighting consumers with delicious snack foods made from top-quality ingredients. Utz’s products are distributed nationally through grocery, mass merchandisers, club, convenience, drug and other channels. Based in Hanover, Pennsylvania, Utz has multiple manufacturing facilities across the U.S. to serve its growing customer base. For more information, please visit www.utzsnacks.com or call 1‐800‐FOR‐SNAX. SPM Communications Utz Brands, Inc. Agency Media Contact Ashley Lennington ashleyL@spmcommunications.com Media Kevin Brick kbrick@utzsnacks.com Investors Noemie Renaertsnrenaerts@utzsnacks.com
Read more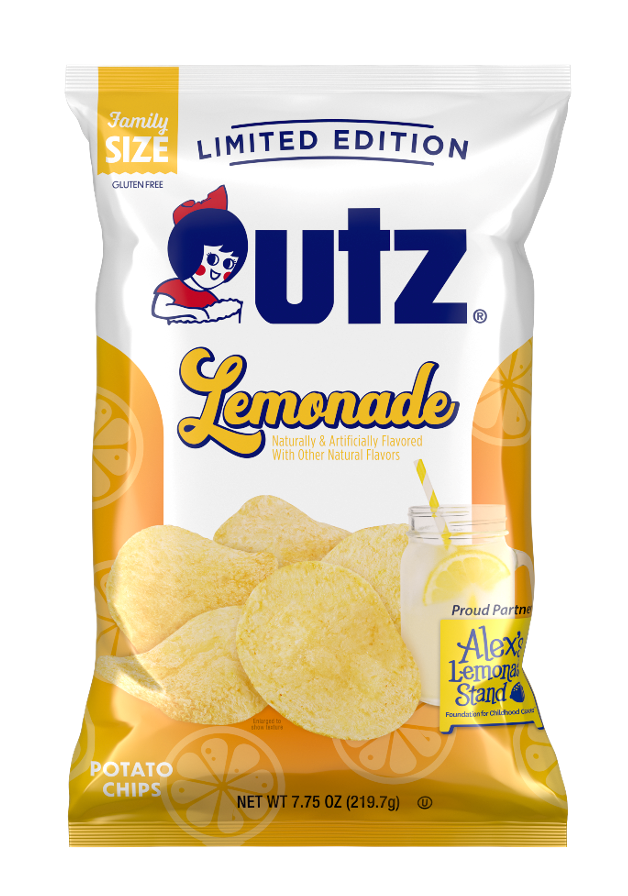
UTZ LAUNCHES LIMITED EDITION LEMONADE POTATO CHIPS
HANOVER, Pa. (BUSINESS WIRE) — Utz®, a leading U.S. salty snack brand, has teamed up with Alex’s Lemonade Stand Foundation, the largest independent childhood cancer charity in the U.S., to introduce its latest innovation: lemonade-flavored potato chips. The new Utz Lemonade Potato Chips combine the tangy sweetness of lemonade with the classic salty crunch of Utz potato chips, delivering a bold, unique flavor experience. “Just in time for summer, Utz Lemonade Potato Chips bring together the nostalgic sweet and tart taste of classic lemonade with the satisfying crunch of another seasonal favorite – potato chips. The new chips are summer in a bite,” said Stacey Schultz, senior vice president of marketing at Utz Quality Foods, LLC, a subsidiary of Utz Brands, Inc. “Beyond the incredible taste, we are also thrilled to partner with and support Alex’s Lemonade Stand Foundation’s incredible work in the fight against childhood cancer.” This limited edition flavor is available in a 7.75-oz. bag through August, while supplies last, online at utzsnacks.com and in leading retailers nationwide. Utz will donate a portion of each bag sold, up to $25,000, to Alex’s Lemonade Stand Foundation, funding critical research and support for children battling cancer. “At Alex’s Lemonade Stand Foundation, we believe that every effort—big or small—helps move us closer to cures for all kids,” said Liz Scott, Alex’s mom and co-executive director at Alex’s Lemonade Stand Foundation. “This partnership with Utz is a fun and meaningful way to bring awareness to our mission, and we’re looking forward to seeing snackers nationwide join the fight against childhood cancer.” Consumers can learn more about Alex’s Lemonade Stand Foundation and support their fight against childhood cancer by visiting AlexsLemonade.org. To learn more about Utz and its new flavors, connect with Utz on Facebook, Instagram and TikTok, and find Alex’s Lemonade Stand Foundation on Facebook, Instagram and TikTok. #UTZLEMONADEPOTATOCHIPS About Utz Brands, Inc. Utz Brands, Inc. (NYSE: UTZ) manufactures a diverse portfolio of savory snacks through popular brands, including Utz®, On The Border® Chips & Dips, Zapp’s®, and Boulder Canyon®, among others. After a century with a strong family heritage, Utz continues to have a passion for exciting and delighting consumers with delicious snack foods made from top-quality ingredients. Utz’s products are distributed nationally through grocery, mass merchandisers, club, convenience, drug, and other channels. Based in Hanover, Pennsylvania, Utz has multiple manufacturing facilities across the U.S. to serve its growing customer base. For more information, please visit www.utzsnacks.com or call 1‐800‐FOR‐SNAX. SPM Communications Utz Brands, Inc. Agency Media Contact Ashley Lennington ashleyL@spmcommunications.com Media Kevin Brick kbrick@utzsnacks.com Investors Kevin Powers kpowers@utzsnacks.com About Alex’s Lemonade Stand Foundation Alex's Lemonade Stand Foundation (ALSF) emerged from the front yard lemonade stand of 4-year-old Alexandra “Alex” Scott, who was fighting cancer and wanted to raise money to find cures for all children with cancer. By the time Alex passed away at the age of 8, she had raised $1 million. Since then, the Foundation bearing her name has evolved into a worldwide fundraising movement and one of the largest independent childhood cancer charities in the U.S. ALSF is a leader in funding pediatric research projects across the globe and providing programs to families affected by childhood cancer. For more information, visit AlexsLemonade.org.
Read moreUTZ® INTRODUCES NEW LIMITED-TIME FLAVORS AND A REDESIGNED BARREL FOR CHEESE BALLS
HANOVER, Pa. (BUSINESS WIRE) — Utz®, a leading U.S. salty snack brand for more than 100 years, is turning up the heat with two bold, limited-time flavors of Cheese Balls — Utz Red Hot and Utz Cheese Pizza Mike’s Hot Honey® — and introducing a newly redesigned barrel for its Cheddar Cheese Balls just in time for National Cheese Ball Day on April 17. Available through October, these two new flavors, available in a 14.5-ounce barrel, join Utz’s fan-favorite original Cheddar Cheese Balls that have been delighting snack fans for generations. The newly redesigned 23-ounce Cheddar Cheese Balls barrel, which is rolling out to retailers nationwide, features a fresh new look while delivering the same delicious Cheese Balls and familiar size that fans know and love. "National Cheese Ball Day is the perfect occasion to introduce our new packaging and two bold new limited-time flavors that take our iconic Cheese Balls to the next level," said Stacey Schultz, senior vice president of marketing at Utz Quality Foods, LLC, a subsidiary of Utz Brands, Inc. "Our Red Hot flavor brings a fiery kick to the classic Cheese Balls, while the Utz Cheese Pizza Mike's Hot Honey flavor delivers an innovative sweet-heat-savory combination that flavor seekers will love." The Utz Cheese Pizza Mike's Hot Honey Cheese Balls mark the third collaboration in the growing partnership between the two brands. Building on the success of Utz Mike's Hot Honey Chips and Utz Mike's Hot Honey Extra Hot Chips, this latest innovation brings the beloved sweet-heat flavor profile to Utz's iconic Cheese Balls format. “Our partnership with Utz continues to grow in delicious new directions with the creation of Utz Cheese Pizza Mike’s Hot Honey Cheese Balls,” said Mike’s Hot Honey founder Mike Kurtz. "The flavor combination originated from our roots as a pizza topping, when we first discovered how perfectly our hot honey pairs with pizza. After the success of our potato chip and pretzel collaborations over the past two years, this was a natural evolution that creates a truly unique snacking experience.” Consumers can find the new Utz Cheddar Cheese Balls barrel and the two new limited-time flavors at leading retailers nationwide, as well as online through utzsnacks.com and Amazon. To learn more about Utz, connect on Facebook, Instagram, and TikTok. Fans can also discover more about Mike’s Hot Honey by connecting with the brand on Facebook, Instagram, and TikTok. #UTZCHEESEBALLS About Utz Brands, Inc. Utz Brands, Inc. (NYSE: UTZ) manufactures a diverse portfolio of savory snacks through popular brands including Utz®, On The Border® Chips & Dips, Zapp’s®, and Boulder Canyon®, among others. After a century with a strong family heritage, Utz continues to have a passion for exciting and delighting consumers with delicious snack foods made from top-quality ingredients. Utz’s products are distributed nationally through grocery, mass merchandisers, club, convenience, drug, and other channels. Based in Hanover, Pennsylvania, Utz has multiple manufacturing facilities across the U.S. to serve its growing customer base. For more information, please visit www.utzsnacks.com or call 1‐800‐FOR‐SNAX. SPM Communications Utz Brands, Inc. Agency Media Contact Ashley Lennington ashleyL@spmcommunications.com Media Kevin Brick kbrick@utzsnacks.com Investors Kevin Powers kpowers@utzsnacks.com About Mike's Hot Honey Mike's Hot Honey, America's original and leading brand of hot honey, has been elevating everyday eating experiences since 2010. Its first drizzle on a pizza at Paulie Gee's in Brooklyn sparked a word-of-mouth sensation, creating a new category of pizza topping. By popular demand, Mike started selling his small-batch, hand-labeled hot honey bottles to visitors of the pizzeria and other local businesses. Today, Mike's Hot Honey can be found in thousands of restaurants and retailers across the country. Using only 100% pure honey infused with real chili peppers, Mike's Hot Honey's sweet-then-heat flavor enhances any dish, from pepperoni pizza to chicken, cheese, charcuterie, ice cream, cocktails and more. Mike's Hot Honey empowers chefs and eaters everywhere to customize, create and share extraordinary meals. Happy drizzling!
Read moreUtz Appoints William J. Kelley Jr. as Chief Financial Officer
Chief Customer Officer to Retire; Utz Appoints Jeremy Stuart Reaffirms Fiscal Year 2025 Outlook and Announces Preliminary First Quarter 2025 Results HANOVER, Pa. – April 17, 2025 (BUSINESS WIRE) – Utz Brands, Inc. (NYSE: UTZ) (“Utz” or the “Company”), a leading U.S. manufacturer of branded salty snacks, today announced the appointment of William J. Kelley Jr. (Bill) as Executive Vice President, Chief Financial Officer and Principal Accounting Officer, effective May 1, 2025. He will succeed Ajay Kataria, who will step down as Executive Vice President, Chief Financial Officer and Principal Accounting Officer on May 1, 2025. Mr. Kelley most recently served as Global Chief Financial Officer at Tropicana Brands Group, Inc. Upon joining Utz on May 1, 2025, he will work closely with Mr. Kataria to help ensure a seamless transition through May 31, 2025. Mr. Kelley will report to Howard Friedman, Chief Executive Officer of Utz. “Bill brings deep financial expertise and operational experience across some of the most respected names in food and beverage. We are excited to welcome him to Utz as we continue executing on our long-term growth strategy,” said Howard Friedman, Chief Executive Officer of Utz. “I want to extend our gratitude to Ajay for his leadership and impact over the past eight years, the last four as CFO — his contributions were many, including as part of our public listing in 2020, multiple acquisitions and integrations, as well as a major ERP installation; all were instrumental in building our financial foundation. We wish Ajay all the best.” Commenting on his appointment, Mr. Kelley said, “I have long admired the Utz brand and the tremendous momentum it has captured behind its geographic expansion. I’m thrilled to be joining the team at such an exciting time and look forward to partnering with Howard and the broader leadership team to drive continued growth and value for shareholders.” “I am incredibly proud of all we have accomplished during my time at Utz,” said Mr. Kataria. “It has been an honor to help grow and expand this great Company. I will be supporting the team during this transition period and look forward to all that is ahead for Utz.” Chief Customer Officer Retirement / Appointment Utz also announced today that Mark Schreiber, Executive Vice President, Sales & Chief Customer Officer, will retire effective May 31, 2025, and will remain in a transition role through the end of June. He will be succeeded by Jeremy Stuart, currently Senior Vice President, Large Format. Mr. Schreiber joined Utz in 2017 and held multiple leadership roles across both Sales and Marketing. During his tenure, Utz’s annual sales grew significantly, supported by successful acquisitions, distribution expansions, and brand integrations. “Mark has been a true champion of the Utz brand and a driving force behind our commercial success. We are incredibly grateful for his leadership and wish him the very best in his well-earned retirement,” said Mr. Friedman. “Jeremy’s deep understanding of the customer landscape and operational focus make him the ideal leader to build on Mark’s legacy and take our customer partnerships to the next level,” added Mr. Friedman. Reaffirming Fiscal Year 2025 Outlook and Announcing Preliminary First Quarter 2025 Results Utz also is reaffirming the 2025 fiscal year outlook it provided in connection with its fourth quarter and full year 2024 results on February 20, 2025, and is also announcing its preliminary first quarter 2025 results. The preliminary first quarter 2025 results are based upon the Company’s estimates, are subject to completion of the Company’s financial closing procedures and review by the Company’s independent registered public accounting firm and do not present all the information for a complete understanding of the Company’s financial condition as of the end of the first quarter of 2025 and its results of operations for the first fiscal quarter of 2025. For the first quarter of 2025 ended March 31, 2025, the Company expects: Net Sales to increase between 1.5% and 1.7% versus the prior year period Organic Net Sales to increase between 2.8% and 3.0% versus the prior year period Net Income of between $4 million and $6 million Adjusted EBITDA of between $44 million and $46 million Diluted Earnings Per Share of between $0.08 and $0.10 Adjusted Earnings Per Share of between $0.14 and $0.16 For the fiscal year 2025 ending December 28, 2025, the Company continues to expect: Organic Net Sales growth of low-single digits led by Branded Salty Snacks growth, particularly the Power Four Brands, and less decline in Non-Branded & Non-Salty Snacks. Adjusted EBITDA growth of 6% to 10% and Adjusted EBITDA Margin expansion of approximately 100bps, led by Adjusted Gross Profit Margin expansion fueled by strong productivity cost savings and improved product mix. Adjusted Earnings Per Share growth of 10% to 15% led by increased operating earnings and lower interest expense. The Company also continues to expect: An effective tax rate (normalized GAAP basis tax expense, which excludes one-time items) in the range of 17% to 19%; Interest expense of approximately $43 million; Capital expenditures in the range of $90 to $100 million with the majority focused on building increased manufacturing network capacity and delivering accelerated productivity savings; and Net Leverage Ratio approaching 3x at fiscal year-end fiscal 2025. Quantitative reconciliations are not available for the forward-looking non-GAAP financial measures used herein without unreasonable efforts due to the high variability, complexity, and low visibility with respect to certain items which are excluded from Organic Net Sales, Adjusted EBITDA, Adjusted Gross Profit Margin, Net Leverage Ratio, normalized GAAP basis tax expense, excluding one-time items, and Adjusted Earnings Per Share, respectively. We expect the variability of these items to have a potentially unpredictable, and potentially significant, impact on our future financial results. As previously announced, Utz will report its full first quarter 2025 financial results on May 1, 2025. About William Kelley Prior to Tropicana Brands Group, Inc., Mr. Kelley held several senior leadership positions at TreeHouse Foods, Inc., including executive vice president and CFO, and earlier in his career he held finance leadership roles at The Kraft Heinz Company, The Hillshire Brands Company, USG Corporation, and PepsiAmericas. He currently serves on the board of THOR Industries, Inc. and chairs its audit committee. Mr. Kelley earned a bachelor’s degree in accounting from Clark-Atlanta University and an MBA from the University of Chicago with a focus on strategy and accounting. About Jeremy Stuart Mr. Stuart joined Utz in September 2023, adding Digital Commerce and Value, Food Service, and Vending to his Large Format responsibilities over the past year. Prior to joining Utz, Mr. Stuart held senior sales roles at The Coca-Cola Company, including franchise leadership general manager leading strategic planning and commercial advice with two of largest Coca-Cola Bottlers in North America. Previously while at The Coca-Cola Company, he served as a global vice president for Costco and vice president for Publix. He holds a bachelor’s degree in economics from the University of California, Santa Barbara About Utz Brands, Inc. Utz Brands, Inc. (NYSE: UTZ) manufactures a diverse portfolio of savory snacks through popular brands, including Utz®, On The Border® Chips & Dips, Zapp’s®, and Boulder Canyon®, among others. After over a century with strong family heritage, Utz continues to have a passion for exciting and delighting consumers with delicious snack foods made from top-quality ingredients. Utz’s products are distributed nationally through grocery, mass merchandisers, club, convenience, drug, and other channels. Based in Hanover, Pennsylvania, Utz has multiple manufacturing facilities located across the U.S. to serve its growing customer base. For more information, please visit www.utzsnacks.com or call 1‐800‐FOR‐SNAX. Investors and others should note that Utz announces material financial information to its investors using its investor relations website (investors.utzsnacks.com), SEC filings, press releases, public conference calls and webcasts. Utz uses these channels, as well as social media, to communicate with our stockholders and the public about the Company, the Company’s products, and other issues. It is possible that the information that Utz posts on social media could be deemed to be material information. Therefore, Utz encourages investors, the media, and others interested in the Company to review the information posted on the social media channels listed on Utz’s investor relations website. Investor Contact Kevin Powers Utz Brands, Inc. kpowers@utzsnacks.com Media Contact Kevin Brick Utz Brands, Inc. kbrick@utzsnacks.com Forward-Looking Statements This press release includes certain statements that are not historical facts but are “forward-looking statements” within the meaning of the “safe harbor” provisions of the Private Securities Litigation Reform Act of 1995, as amended. The forward-looking statements generally are accompanied by or include, without limitation, forward-looking or conditional statements such as “will”, “expect”, “intends”, “goal”, “flexibility,” “positioned” or other similar words, phrases or expressions. These forward-looking statements include future plans for the Company, the estimated or anticipated future results and benefits of the Company’s future plans and operations, including with respect to promotional activities and efforts to build sustainable long-term demand for the Company’s products; plans related to the Company’s executive leadership transition; the Company’s product mix; the estimated or anticipated future results and benefits of the Company’s plans and operations; future capital structure; future opportunities for the Company; the Company’s projected balance sheet and liabilities, including net leverage; and other statements that are not historical facts. These statements are based on the current expectations of the Company’s management and are not predictions of actual performance. These statements are subject to a number of risks and uncertainties and the Company’s business and actual results may differ materially. Factors that may cause such differences include, but are not limited to: risks associated with our executive leadership transition; our operation in an industry with high levels of competition and consolidation; our reliance on key customers and ability to obtain favorable contractual terms and protections with customers; changes in demand for our products driven by changes in consumer preferences and tastes or our ability to innovate or market our products effectively; changes in consumers’ loyalty to our brands due to factors beyond our control; impacts on our reputation caused by concerns relating to the quality and safety of our products, ingredients, packaging, or processing techniques; the potential that our products might need to be recalled if they become adulterated or are mislabeled; the loss of retail shelf space and disruption to sales of food products due to changes in retail distribution arrangements; our reliance on third parties to effectively operate both our direct-to-warehouse delivery system and our direct-store-delivery network system; the evolution of e-commerce retailers and sales channels; disruption to our manufacturing operations, supply chain, or distribution channels; the effects of inflation, including rising labor costs; shortages of raw materials, energy, water, and other supplies; changes in the legal and regulatory environments in which we operate; potential liabilities and costs from litigation, claims, legal or regulatory proceedings, inquiries, or investigations into our business; potential adverse effects or unintended consequences related to the implementation of our growth strategy; our ability to successfully identify and execute acquisitions or dispositions and to manage integration or carve out issues following such transactions; the geographic concentration of our markets; our ability to attract and retain highly skilled personnel; impairment in the carrying value of goodwill or other intangible assets; our ability to protect our intellectual property rights; disruptions, failures, or security breaches of our information technology infrastructure; climate change or legal, regulatory or market measures to address climate change; our exposure to liabilities, claims or new laws or regulations with respect to environmental matters; the increasing focus and opposing views, legislation and expectations with respect to ESG initiatives; restrictions on our operations imposed by covenants in our debt instruments; our exposure to changes in interest rates; adverse impacts from disruptions in the worldwide financial markets, including on our ability to obtain new credit; our exposure to any new or increased income or product taxes; pandemics, epidemics or other disease outbreaks; our exposure to changes to trade policies and tariff and import/export regulations by the United States and other jurisdictions; potential volatility in our Class A Common Stock caused by resales thereof; our dependence on distributions made by our subsidiaries; our payment obligations pursuant to a tax receivable agreement, which in certain cases may exceed the tax benefits we realize or be accelerated; provisions of Delaware law and our governing documents and other agreements that could limit the ability of stockholders to take certain actions or delay or discourage takeover attempts that stockholders may consider favorable; our exclusive forum provisions in our governing documents; the influence of certain significant stockholders and members of Utz Brands Holdings, LLC, whose interests may differ from those of our other stockholders; and the effects of our private placement warrants on the market price of our Class A Common Stock and our net income; and other risks and uncertainties set forth in the section entitled “Risk Factors” and “Forward-Looking Statements” in the Company’s Annual Report on Form 10-K filed with the Commission, for the fiscal year ended December 29, 2024, and other reports filed by the Company with the SEC. In addition, forward-looking statements provide the Company’s expectations, plans or forecasts of future events and views as of the date of this communication. These forward-looking statements should not be relied upon as representing the Company’s assessments as of any date subsequent to the date of this communication. The Company cautions investors not to place undue reliance upon any forward-looking statements, which speak only as of the date made. The Company does not undertake or accept any obligation or undertaking to release publicly any updates or revisions to any forward-looking statements to reflect any change in its expectations or any change in events, conditions, or circumstances on which any such statement is based, except as otherwise required by law. Non-GAAP Financial Measures: Utz uses non-GAAP financial information and believes it is useful to investors as it provides additional information to facilitate comparisons of historical operating results, identify trends in our underlying operating results, and provide additional insight and transparency on how we evaluate the business. We use non-GAAP financial measures to budget, make operating and strategic decisions, and evaluate our performance. These non-GAAP financial measures do not represent financial performance in accordance with generally accepted accounted principles in the United States (GAAP) and may exclude items that are significant to understanding and assessing financial results. Therefore, these measures should not be considered in isolation or as an alternative to net sales, net income, cash flows from operations, diluted earnings per share or other measures of profitability, liquidity, or performance under GAAP. You should be aware that the presentation of these measures may not be comparable to similarly titled measures used by other companies. Management believes that non-GAAP financial measures should be considered as supplements to the GAAP measures reported, should not be considered replacements for, or superior to, the GAAP measures, and may not be comparable to similarly named measures used by other companies. The Company’s calculation of the non-GAAP financial measures may differ from methods used by other companies. We believe that these non-GAAP financial measures provide useful information to investors regarding certain financial and business trends relating to the financial condition and results of operations of the Company to date when considered with both the GAAP results and the reconciliations to the most comparable GAAP measures, and that the presentation of non-GAAP financial measures is useful to investors in the evaluation of our operating performance compared to other companies in the Salty Snack industry, as similar measures are commonly used by the companies in this industry. These non-GAAP financial measures are subject to inherent limitations as they reflect the exercise of management judgment about which expense and income are excluded or included in determining these non-GAAP financial measures. The non-GAAP financial measures are not recognized in accordance with GAAP and should not be viewed as an alternative to GAAP measures. As new events or circumstances arise, these definitions could change. When the definitions change, we will provide the updated definitions and present the related non-GAAP historical results on a comparable basis. Utz uses the following non-GAAP financial measures in its financial communications, and in the future could use others: Organic Net Sales Adjusted Gross Profit Adjusted Gross Profit as % of Net Sales (Adjusted Gross Profit Margin) Adjusted Selling, Distribution, and Administrative Expense Adjusted Selling, Distribution, and Administrative Expense as % of Net Sales Adjusted Net Income Adjusted Earnings Per Share Adjusted Earnings Before Tax EBITDA Adjusted EBITDA Adjusted EBITDA as % of Net Sales (Adjusted EBITDA Margin) Normalized Adjusted EBITDA Effective Normalized Tax Rate Net Leverage Ratio Organic Net Sales is defined as net sales excluding the impacts of acquisitions, divestitures and independent operator (“IO”) route conversions. Adjusted Gross Profit represents Gross Profit excluding Depreciation and Amortization expense, a non-cash item. In addition, Adjusted Gross Profit excludes the impact of costs that fall within the categories of non-cash adjustments and/or other cash adjustment items such as those related to stock-based compensation, hedging and purchase commitments adjustments, asset impairments, acquisition and integration costs, business transformation initiatives, and financing-related costs. Adjusted Gross Profit is one of the key performance indicators that our management uses to evaluate operating performance. We also report Adjusted Gross Profit as a percentage of Net Sales as an additional measure for investors to evaluate our Adjusted Gross Profit Margin on Net Sales. Adjusted Selling, Distribution, and Administrative Expense is defined as all Selling, Distribution, and Administrative expense excluding Depreciation and Amortization expense, a non- cash item. In addition, Adjusted Selling, Distribution, and Administrative Expense excludes the impact of costs that fall within the categories of non-cash adjustments and/or other cash adjustment items such as those related to stock-based compensation, hedging and purchase commitments adjustments, asset impairments, acquisition and integration costs, business transformation initiatives, and financing-related costs. We also report Adjusted Selling, Distribution, and Administrative Expense as a percentage of Net Sales as an additional measure for investors to evaluate our Adjusted Selling, Distribution, and Administrative Margin on Net Sales. Adjusted Net Income is defined as Net Income excluding the additional Depreciation and Amortization expense, a non-cash item, related to fair value adjustments on property, plant, and equipment, and definite-lived intangibles relate to business combinations recorded in prior periods. In addition, Adjusted Net Income is also adjusted to exclude deferred financing fees, interest income, and expense relating to IO loans and certain non-cash adjustments and/or other cash adjustment items such as those related to stock-based compensation, hedging, and purchase commitments adjustments, asset impairments, acquisition and integration costs, business transformation initiatives, remeasurement of warrant liabilities and financing-related costs. Lastly, Adjusted Net Income normalizes the income tax provision to account for the above-mentioned adjustments. Adjusted Earnings Before Tax is defined as Adjusted Net Income before normalized GAAP basis tax expense. Adjusted Earnings Per Share is defined as Adjusted Net Income (as defined above) divided by the weighted average shares outstanding for each period on a fully diluted basis, assuming the Private Placement Warrants are net settled and the Shares of Class V Common Stock held by Continuing Members are converted to Class A Common Stock. EBITDA is defined as Net Income Before Interest, Income Taxes, and Depreciation and Amortization. Adjusted EBITDA is defined as EBITDA further adjusted to exclude certain non-cash adjustments and/or other cash adjustment items, such as stock-based compensation, hedging and purchase commitments adjustments, asset impairments, acquisition and integration costs, business transformation initiatives; and financing-related costs. Adjusted EBITDA is one of the key performance indicators we use in evaluating our operating performance and in making financial, operating, and planning decisions. We believe Adjusted EBITDA is useful to the users of this release because the financial information contained in the release can be used in the evaluation of Utz’s operating performance compared to other companies in the Salty Snack industry, as similar measures are commonly used by companies in this industry. We also provide in this release, Adjusted EBITDA as a percentage of Net Sales, as an additional measure for readers to evaluate our Adjusted EBITDA Margin on Net Sales. Normalized Adjusted EBITDA is defined as Adjusted EBITDA after giving effect to pre-acquisition Adjusted EBITDA for certain acquisitions and dispositions from time to time. Effective Normalized Tax Rate is defined as normalized GAAP basis tax expense, which excludes one-time items, divided by Adjusted Earnings before Tax. Net Leverage Ratio is defined as Normalized Adjusted EBITDA divided by Net Debt. Net Debt is defined as Gross Debt less Cash and Cash Equivalents.
Read more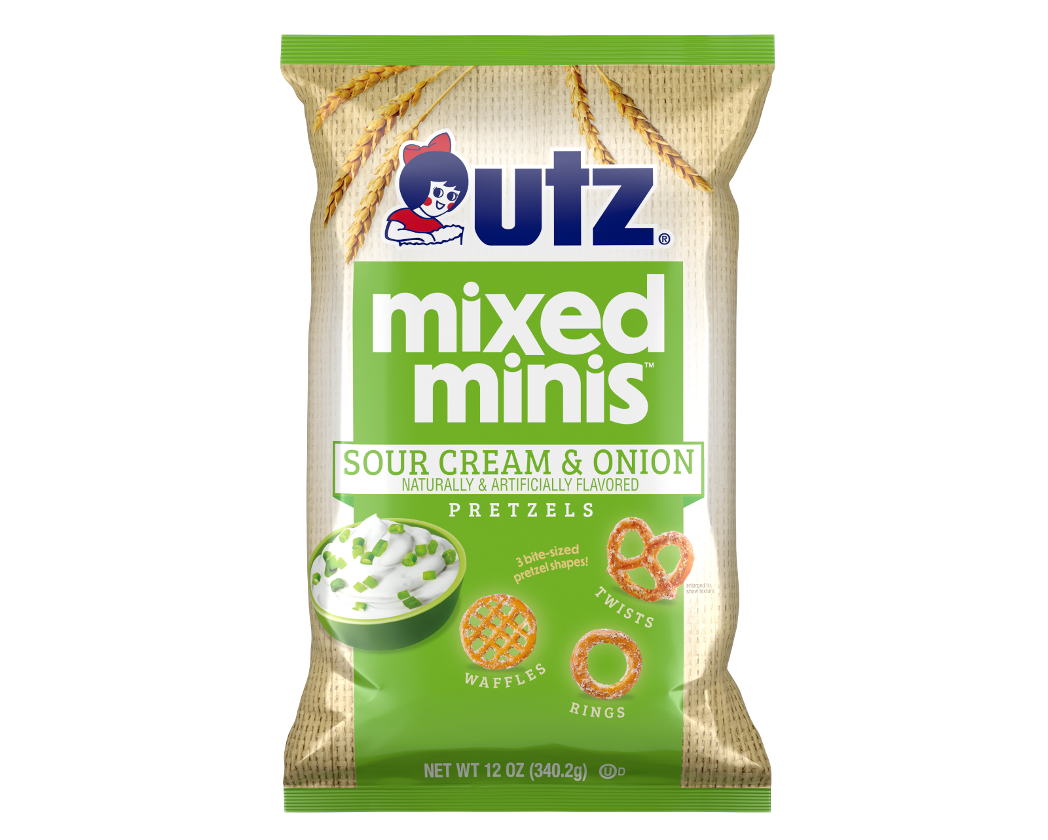
UTZ® ADDS NEW SOUR CREAM & ONION FLAVOR TO MIXED MINIS® PRETZEL LINE
HANOVER, Pa. (BUSINESS WIRE) — Utz®, a leading U.S. salty snack brand, has introduced Sour Cream & Onion flavor to its Mixed Minis Pretzel line. The new flavor is inspired by the brand’s top-selling flavored potato chip and brings the bold taste to Utz’s crunchy, bite-sized pretzels. Sour Cream & Onion Mixed Minis, available in 12-ounce packages, feature a savory blend of tangy sour cream and bold onion flavors, creating a deliciously balanced bite. The Utz Mixed Minis Pretzel line first launched in February 2024 and brings a fun twist to classic Utz Pretzels in the form of three bite-sized shapes: Twists, Rings and Waffles. Sour Cream & Onion joins two existing flavors in the line, including: • Garlic Butter: deliciously seasoned pretzels covered with a rich and savory flavor combination of garlic and butter• Mike’s Hot Honey®: the perfect balance of sweet heat from Mike’s Hot Honey combined with the satisfying crunch of Utz pretzels “At Utz, we are always looking for ways to bring bold flavors to snack lovers,” said Stacey Schultz, senior vice president of marketing, Utz Quality Foods, LLC, a subsidiary of Utz Brands, Inc. “By bringing one of our most beloved potato chip flavors into our Mixed Minis Pretzel line, we’re giving fans a whole new way to enjoy that irresistible taste and crunch they love.” In addition to expanding the Mixed Minis line, Utz recently added Mini Twists Pretzels in a new 16-ounce size to its lineup. These bite-sized twists showcase Utz’s commitment to unmatched flavor, using treasured family recipes to create the most flavorful snacks. Crafted through a perfected process that ensures the right amount of crunch in every bite, these pretzels can be enjoyed straight from the bag or paired with dips for extra flavor. Utz products are available online at utzsnacks.com and at leading retailers nationwide. To learn more about Utz, connect on Facebook, Instagram, and TikTok. #UTZMIXEDMINISPRETZELS About Utz Brands, Inc. Utz Brands, Inc. (NYSE: UTZ) manufactures a diverse portfolio of savory snacks through popular brands, including Utz®, On The Border® Chips & Dips, Zapp’s®, and Boulder Canyon®, among others. After a century with a strong family heritage, Utz continues to have a passion for exciting and delighting consumers with delicious snack foods made from top-quality ingredients. Utz's products are distributed nationally through grocery, mass merchandisers, club, convenience, drug, and other channels. Based in Hanover, Pennsylvania, Utz has multiple manufacturing facilities located across the U.S. to serve our growing customer base. For more information, please visit www.utzsnacks.com or call 1‐800‐FOR‐SNAX. SPM Communications Utz Brands, Inc. Agency Media Contact Ashley Lennington ashleyL@spmcommunications.com Media Kevin Brick kbrick@utzsnacks.com Investors Kevin Powers kpowers@utzsnacks.com
Read moreZAPP’S® BRINGS BOLD FLAVOR TO NEW ORLEANS FOR CARNIVAL SEASON
HANOVER, Pa. – Zapp’s, a bold, daringly different brand of chips and pretzels inspired by the flavors of New Orleans, is celebrating the Mardi Gras season with the launch of its new Big Cheezy Sinfully-Seasoned® Pretzel Stix, adding extra flavor to the city’s already electric atmosphere. Big Cheezy Pretzel Stix are coated with a blend of cheddar cheese flavor and Cajun seasoning for a flavorful, crunchy pretzel. The new flavor joins Zapp’s existing Sinfully-Seasoned Pretzel Stix lineup, which includes Voodoo®, Jazzy Honey Mustard, Sweet Cinnamon & Sugar, and Spicy Cajun. “Zapp's is rooted in the unique flavors and fun of New Orleans and is inspired by all the city has to offer,” said Utz Quality Foods, LLC a subsidiary of Utz Brands, Inc. Senior Vice President of Marketing Stacey Schultz. “Carnival and Mardi Gras is the city’s signature season and the perfect time to introduce the Big Cheezy Pretzel Stix, a bold snack inspired by the spirit of New Orleans.” Available in 1.5-ounce bags and 16-ounce bags, Big Cheezy Pretzel Stix are twisted to hold more of Zapp’s special, secret seasonings for a bigger, bolder flavor Zapp’s fans crave. Leading up to Mardi Gras, Zapp’s gave fans who won a spot on its exclusive Tastemaker Tours the opportunity to join in on an unforgettable Mardi Gras experience in the heart of NOLA. The tours highlighted the city’s unique flavors and culture, including sampling experimental menu items at a local bakery, joining a Mardi Gras parade, enjoying a jazz tour at the New Orleans Jazz Museum, and visiting the historic St. Louis Cemetery. This hands-on experience allowed guests to immerse themselves in the true essence of New Orleans, and Chanen and Juwan Johnson and Kool-Aid McKinstry surprised and delighted a tour, creating an unforgettable experience. Fans looking to experience some of the Tastemaker spots can follow @RealZappsChips for details. To learn more about Zapp's and its new flavors, visit Zapp’s website or connect with Zapp’s on Facebook, Instagram, and TikTok. And, as always, “Laissez les bons temps rouler!” #ZAPPS #ZAPPSPRETZELS # # # About Utz Brands, Inc. Utz Brands, Inc. (NYSE: UTZ) manufactures a diverse portfolio of savory snacks through popular brands, including Utz®, On The Border® Chips & Dips, Zapp’s® and Boulder Canyon®, among others. After a century with a strong family heritage, Utz continues to have a passion for exciting and delighting consumers with delicious snack foods made from top-quality ingredients. Utz's products are distributed nationally through grocery, mass merchandisers, club, convenience, drug, and other channels. Based in Hanover, Pennsylvania, Utz has multiple manufacturing facilities located across the U.S. to serve our growing customer base. For more information, please visit www.utzsnacks.com or call 1‐800‐FOR‐SNAX. SPM Communications Utz Brands, Inc. Agency Media Contact Ashley Lennington ashleyL@spmcommunications.com Media Kevin Brick kbrick@utzsnacks.com Investors Kevin Powers kpowers@utzsnacks.com
Read more
BOULDER CANYON® SHOWCASES NEW AND BESTSELLING PRODUCTS AT NATURAL PRODUCTS EXPO WEST 2025
HANOVER, Pa. (BUSINESS WIRE) — Boulder Canyon®, a pioneer in the better-for-you snack movement, will showcase its distinctive snacks at the Natural Products Expo West 2025, held March 4-7 at the Anaheim Convention Center, in Hall A, Booth 1017. Boulder Canyon offers a variety of snacks, most of which are made with avocado oil and are non-GMO verified. At Expo West, Boulder Canyon will sample new and fan-favorite products, including: NEW Boulder Batch – Mike’s Hot Honey® potato chips, featuring hot honey for a sweet, spicy crunch, launch in April. NEW Tortilla Chips, made with avocado oil and lightly seasoned, available in Sea Salt, Blue Corn, and Lime & Sea Salt, launch in May. · Wavy Chips, new, ridged potato chips cooked in avocado oil, debuted exclusively at Whole Foods Market in September 2024 and offer a softer bite compared to a traditional kettle chip. Available nationally in Sea Salt and Cheddar Sour Cream. The brand will also be showcasing some of its bestsellers, including: · Canyon Poppers®, the brand’s first expansion beyond traditional chips, were introduced last year in Aged White Cheddar and Jalapeño Ranch. · Avocado Oil Hickory Barbeque Kettle Cooked Potato Chips, made with high-quality potatoes and cooked in small batches, feature a sweet, smoky flavor with garlic and onion. · Multipacks & Variety Packs, recently introduced in a variety of sizes, feature Boulder Canyon’s best-selling avocado oil products in convenient single-serve bags. “At Expo West, we’re giving a first look at Boulder Canyon’s latest innovations, including our new Tortilla Chips and Wavy Potato Chips, both cooked in avocado oil,” said Vice President of Marketing Korlin Serauskis of Utz Quality Foods, LLC, a subsidiary of Utz Brands, Inc. “Boulder Canyon has always been committed to delivering bold, better-for-you snacks, and this year, we’re continuing the tradition by introducing flavors and forms that elevate the snacking experience and set a new standard for the category.” Boulder Canyon products are available for purchase online at www.bouldercanyon.com or from leading retailers nationwide. For more information, follow Boulder Canyon on Facebook, Instagram and TikTok. About Utz Brands, Inc. Utz Brands, Inc. (NYSE: UTZ) manufactures a diverse portfolio of savory snacks through popular brands, including Utz®, On The Border® Chips & Dips, Zapp’s® and Boulder Canyon®, among others. After a century with a strong family heritage, Utz continues to have a passion for exciting and delighting consumers with delicious snack foods made from top-quality ingredients. Utz’s products are distributed nationally through grocery, mass merchandisers, club, convenience, drug and other channels. Based in Hanover, Pennsylvania, Utz has multiple manufacturing facilities across the U.S. to serve its growing customer base. For more information, please visit www.utzsnacks.com or call 1‐800‐FOR‐SNAX. SPM Communications Utz Brands, Inc. Agency Media Contact Ashley Lennington ashleyL@spmcommunications.com Media Kevin Brick kbrick@utzsnacks.com Investors Kevin Powers kpowers@utzsnacks.com
Read more